- Need assistance?
- 1-888-762-2568
- Contact Us
10x Visium® HD Spatial Gene Expression
and Visium® Digital
Make a bold move toward the latest in high-resolution whole transcriptome gene sequencing. With BioChain’s in-house expertise and available CytAssist workflow, you can take advantage of the new 10x Visium HD Spatial Gene Expression kit. Building on the features of Visium Digital Spatial Gene Expression, you can now delve deeper, assess more thoroughly, and visualize protein, total mRNA, and morphology with continuous, uninterrupted tissue coverage. 10x Visium Digital and Visium HD Spatial Gene Expression are here for your spatial transcriptomic needs.
*Please note: Visium HD is currently available for preorder.
Features & Benefits
Building on the 10x Visium Digital Spatial Gene Expression kit, Visium HD has exciting new features that open spatial assay horizons. Map the whole transcriptome within the tissue context at high-definition 2um resolution. Unravel biological architectures in normal and diseased tissue and discover new biomarkers. Visualize the spatial organization of awe-inspiring cell types, states, and biomarkers.
Features Available in Both 10x Visium HD and Visium Digital Spatial Gene Expression:
- Flexible: suitable for both FFPE & fresh-frozen tissues
- Comprehensive: analyze the whole transcriptome on entire tissue sections
- Adaptable: combine with immunofluorescence protein detection
Features Unique to Visium HD:
- High-Resolution: capture spatial data at 2um resolution thanks to new slide architecture; a sharp contrast to the 55um of the original Visium assay.
- Continuous Coverage: visualize DNA, RNA, and protein with no gaps between captured areas
- Precise Transcript Localization: use Visium CytAssist technology to fix your data to your slide perfectly

NOW OFFERING 10x Visium® HD Spatial Gene Expression
- High-definition 2um resolution
- Whole transcriptome gene sequencing at single cell scale
- Continuous tissue coverage – no more spots with gaps! Visium HD offers a continuous “lawn” of barcodes across the tissue
Interested in learning more about Visium HD Spatial Gene Expression?

10x Visium Characterized Tissues
No experimental setup, no delays, and no hassle! 10x Visium characterized tissues, including elusive matched pair tissues, are ready to ship off the shelf. Review the tissues and the data unreservedly before you buy! Or request a custom project to have a bespoke tailored experience molded to you for further experiential control. (Shown: Mouse Brain Sagittal Anterior- Fresh Frozen - Whole Transcriptome, Visium-Characterized)
Visium workflow with CytAssist
Streamline experimentation with a ready-to-use, robust workflow that smoothly integrates easily into current laboratory methods and tools for whole tissue section analysis. With 10x Visium Digital Spatial Gene Expression, you can gain a holistic view of disease complexity, discover new biomarkers, map the spatial organization of cell atlases, and identify spatiotemporal gene expression patterns.

Facilitate transfer of transcriptomic probes in FFPE or fresh frozen samples with Visium CytAssist. In the Visium CytAssist workflow, sectioning, tissue preparation, staining (H&E or IF), and imaging take place on a standard glass slide. After probe hybridization, two standard glass slides and a Visium slide with two Capture Areas are placed in the CytAssist instrument so that the tissue sections on the standard slides can be aligned on top of the Capture Areas. Within the instrument, a brightfield image is captured to provide spatial orientation for data analysis, followed by hybridization of transcriptomic probes to the Visium slide. The remaining steps, starting with probe extension, follow the standard Visium workflow outside of the instrument.
FFPE Tissues
- The tissues are permeabilized to release ligated probe pairs that bind to adjacent capture probes on the slide, allowing for the capture of gene expression information.
- Pairs of probes specific to each gene in the protein-coding transcriptome are hybridized to their gene target and then ligated to one another.
- The probe pairs are extended to incorporate complements of the spatial barcodes and sequencing libraries prepared.
Fresh-Frozen Tissues
- In fresh-frozen tissues, RNA is released by fixing and permeabilizing – which binds to adjacent capture probes to allow capture of gene expression information.
- Then sequencing libraries are prepared by synthesizing and capturing RNA.
Spatially Resolved Clustering
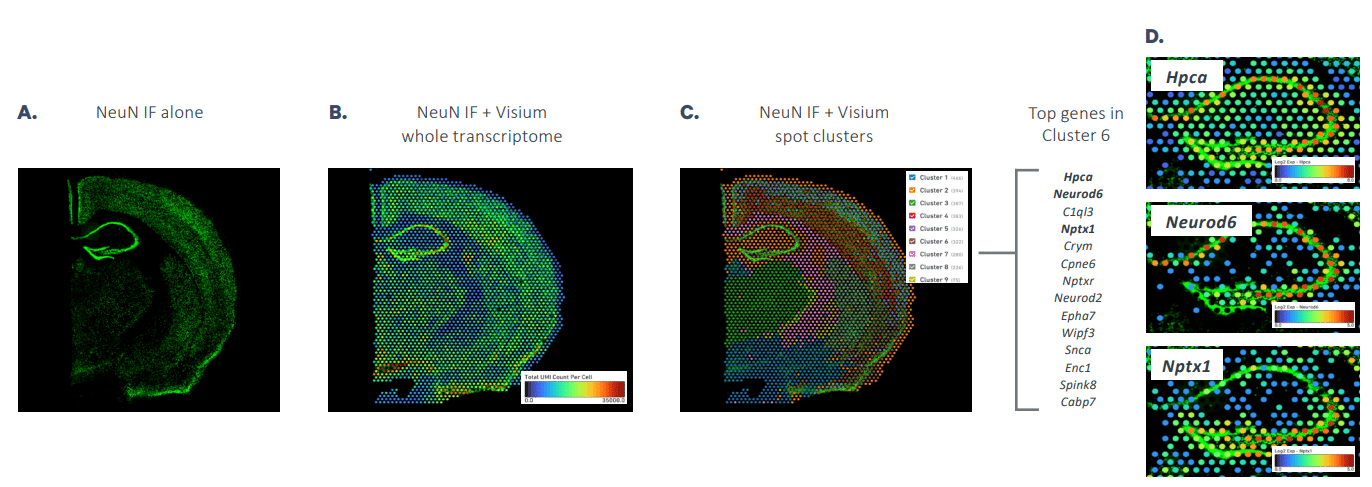
Spatially resolved clustering based on simultaneous gene expression and protein detection in the mouse brain.
A mouse brain section was labeled using immunofluorescence to visualize NeuN and then processed through the Visium Spatial Gene Expression workflow.

(A) an IF-only image
(B) an IF image overlaid with Visium data containing total UMI counts
(C) an IF image overlaid with Visium data for spatially naïve clustering based on total differentially expressed genes
(D) The top 10 genes that are more highly expressed in Cluster 6 are shown to the right along with example images.
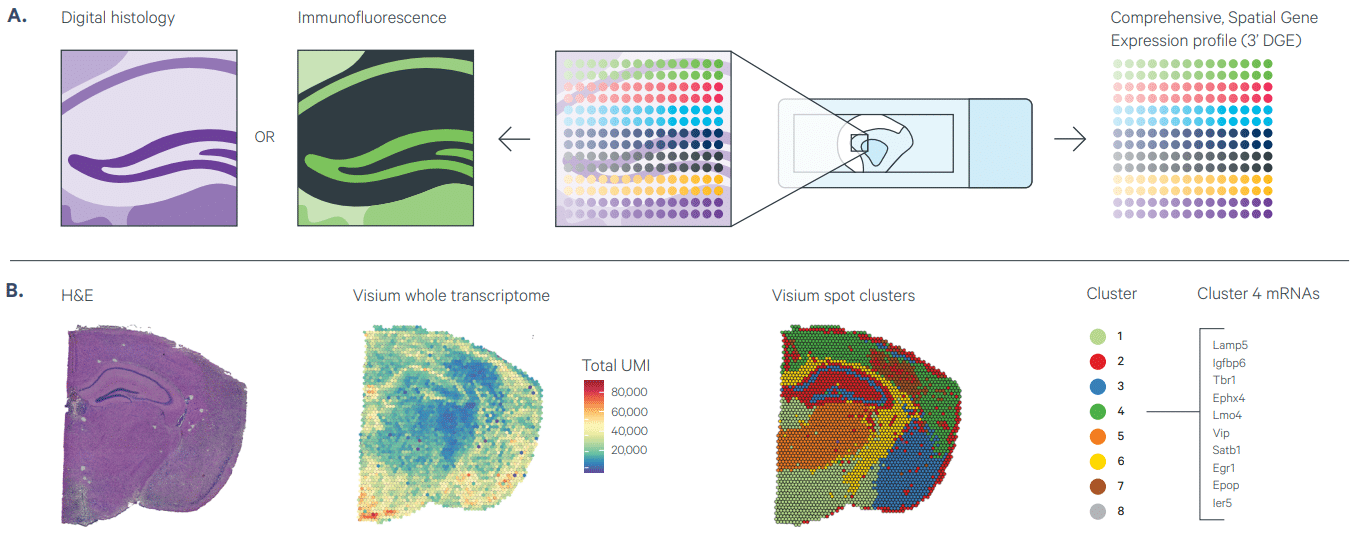
Gain High-Resolution Characterization of Gene and Protein Expression

(A) Visium Spatial Gene Expression provides unbiased or targeted gene expression readout in intact sections from fresh-frozen tissue. The workflow is compatible with H&E to provide morphological context and IF staining to co-detect protein from the same tissue section.
(B) Shown on the left is an H&E image for a coronal mouse brain section, followed by an overlay of Visium data for total unique molecular identifiers (UMIs) for whole transcriptome analysis or spatially naïve spot clustering based on total differentially expressed genes. Listed on the far right are the most highly expressed genes in Cluster 4.
(Source: 10x Genomics)
Spatially Resolved Clustering & Gene Expression Analysis
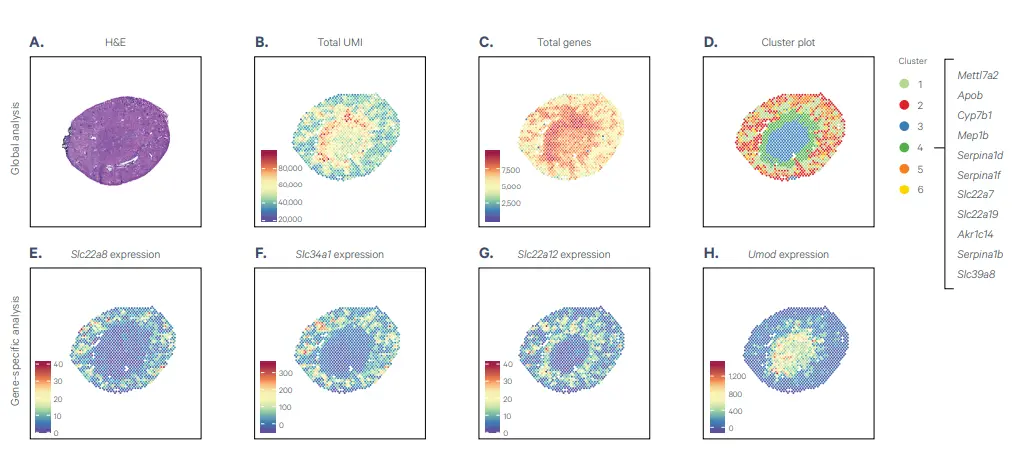
Shown is the spatially resolved clustering and gene expression in the mouse kidney. Top Row: Top row depicts global analysis of tissue morphology, gene expression, and clustering. Bottom Row: The bottom row depicts gene-specific analysis of a few select genes. (Source: 10x Genomics)
A. A coronal mouse kidney section was H&E stained, imaged, then processed through the Visium Spatial Gene Expression for fresh frozen tissue workflow. Shown is spatially naïve clustering based on total differentially expressed genes and image overlays containing data for:
- (B) UMI counts
- (C) total gene count
D. The top 11 genes that are more highly expressed in Cluster 4 (green) than any other cluster is shown to the far right. Examples of the many mRNAs that can be analyzed in a single experiment are also depicted, all coinciding with known expression patterns: (E) Slc22a8, (F) Slc34a1, (G) Slc22a12, (H) Umod.

Co-Detect Protein and Whole Transcriptome
Human breast ductal carcinoma in situ

Histological tools like in situ hybridization or immunohistochemistry are limited in the breadth of analysis they can perform. With protein detection by immunofluorescence one can visualize spatial patterns of gene expression.
The Visium spatial gene expression solution increases the level of precision by blending immunofluorescence protein detection and unbiased, spatial gene expression in the same tissue section alongside histological analysis.
The Significant Difference - the ability to localize rare cell subtypes in patient samples, characterize immune cell activation state, or resolve post-translational modifications and cell signaling in intact tissue, without letting go of whole transcriptome data. The combined workflow of Visium Spatial Gene Expression with Immunofluorescence makes it simpler to implement spatial transcriptomics technology into standard methods of tissue sectioning and immunofluorescence staining.
Over 125+ Publications & Preprints

Interested in 10x Visium® or just want to learn more?
Reach out about your project with one click! Address all of your concerns or questions with our live spatial consulting to see what is best for you.
Disclaimer: Content in part from 10x Genomics. All rights reserved by respective original owners.
Other Custom Services
Histology Services
BioChain has been procuring biospecimens for over 20 years and specializes in providing many useful histological services for downstream customer applications.
Custom Extraction & Purification
BioChain has developed proprietary reagents for the extraction of biomolecules from a wide variety of sample types.


